
The most often discussed metric about one’s Internet connection is how ‘fast’ it is as measured by the various speed tests out there.
What is often overlooked is just as vital a question: How good is my internet connection? We’ll get to that as we discuss ‘speed’.
ISP Line speed
One first encounters the notion of speed when we first sign up for a plan with an Internet Service Provider (ISP) and choose from their offerings, which typically are based on the download speed the plan claims to offer.
Depending on the type of technology the ISP uses to provide that service, this ‘speed’ is not necessarily what can actually be achieved in the home.
For example, on DSL technology, the ISP’s ‘speed’ is the rate at which their modem connects to their lines, not what you’ll actually get in your home. And even then it can vary depending on the quality of the line and home wiring.
It rarely accounts for certain protocol overhead like PPPoE and others, so the actual usable bandwidth for YOUR traffic is typically a good 10% or so less than the advertised plan speed.
For cable, it’s typically much closer to the advertised rates.
Speed tests, how do they work?
A speed test is accomplished by flooding the line with data, hitting multiple servers on the internet and measuring the capacity of the line in both directions. First downloading as much as possible, then reversing direction and uploading as much as possible. During this process, some tests measure additional properties we’ll discuss further on.
The goal is to see how much data can be pushed through in a given period of time, which only really measures ‘capacity’ not performance as in ‘this page loaded quickly’. Since the ISP sells plans based on capacity of the line, most people use these tests to hold the ISP’s feet to the fire regarding their plan’s actual capacity.
However, ‘speed’ or capacity does not tell you anything about the quality or real performance of the line. Some tests do, and we highly recommend the test available at Waveform as it provides many more metrics, including ones critical to usability.
Drag race vs road circuit

Evaluating your Internet based solely on capacity is like evaluating a car only on its ¼ mile drag-strip time. Most of us use our cars on roads that have curves, hills and other challenges where handling, braking and many other factors lead to great lap times on a road circuit.
Good speed tests also report important factors like the lag or latency present on the line when under load. Often called by its more technical term ‘Bufferboat’, this is actually vital to your Internet quality experience. A grade of F means streaming will constantly pause or buffer, VoIP calls and VPN sessions get cut-off. Pages fail to fully load, or load slowly.
Some also have a ‘quality’ metric that takes into account how much re-transmission percentage is required as well as ping loss to primarily evaluate the ISP’s network reliability, this may also be impacted by your local line, modem and router. For instance, a bad telephone line wiring can cause a DSL modem to have high packet loss. Or an overly congested or poor-quality backhaul in the ISP network can drop packets as well. But another thing that can cause this rating to be poor is the re-transmission due to traffic management, so soon after deploying routers with traffic management, this can be high, as the TCP stacks in the client devices adapt to the push-back that ensures quality. This article explains packet-loss further.
Another important metric some tests report is the Round Trip Time or RTT, which is a measure of how long it takes for a full round-trip of a request/response between your computer and the remote server. This article goes into more depth on how RTT plays into ‘Speed’.
Also associated with this is a metric called jitter, which measures the timing consistency of the requests. High values here indicate problems with data flow management and the effects on the use are mostly felt with real-time applications like gamming or VoIP. Lower jitter is better.
Traffic management and speed
Just like on large metropolitan highways, congestion at certain times of the day can cause traffic bottlenecks and even come to a complete stand-still. But with a well implemented traffic management scheme that controls on-ramp feed rates and highway velocities, the traffic can continue to flow, albeit not quite at the max speed possible when no congestion is occurring.
The IQrouter traffic management establishes a safe ‘max speed’ for your specific line, this is generally 5% to 10% less than your lines true ‘uncontrolled’ max speed. So when congestion starts to build up, the IQrouter algorithms manage the traffic to be at or under the safe speed. And when the line capacity is congested to the maximum, the traffic management pushes back harder, yielding measured speeds of 20% or so of the actual maximum uncontrolled speed. Again, here ‘speed’ is really measuring capacity.
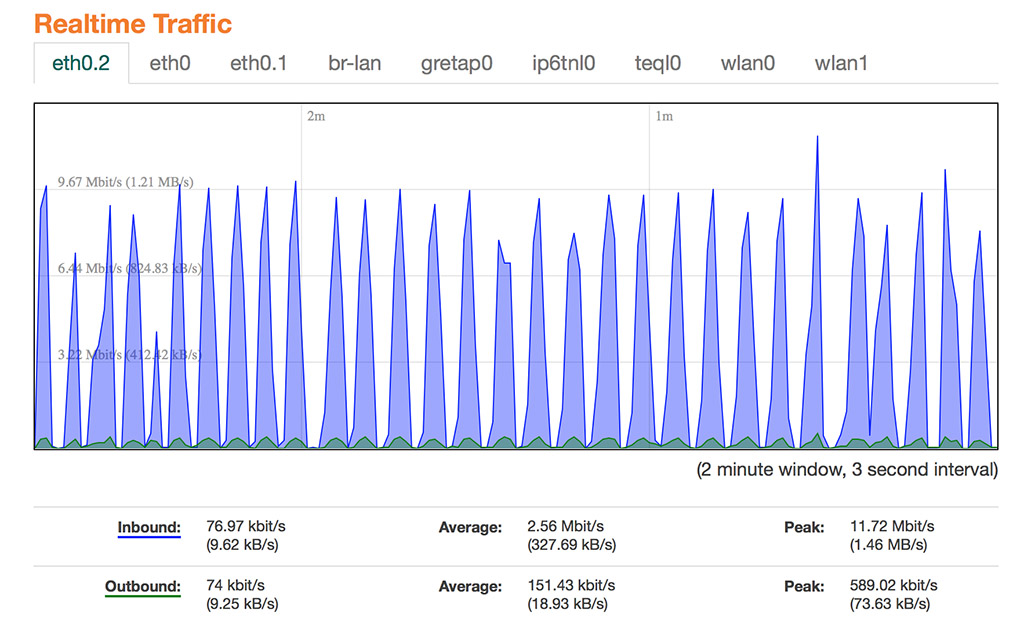
But even with traffic management on, when not congested, data is flowing at whatever speed the line can actually deliver. This is important to reinforce: under ‘normal’ conditions, traffic goes at max line speed. To illustrate, here is the traffic graph of a 12Mbps DSL line during some video streaming, note how the peak inbound (download) rate is almost 12mbps, but a measured speed test would show less than 9Mbps due to congestion management.
But since a speed test floods the line with data to measure the capacity, by definition it’s causing the line to be congested. So a traffic managed router will do its job and keep traffic under control, which then results in lower measured speed. Which is fine, as we want smooth, steady performance so stuff works, especially during congested periods.
Looking at the bufferbloat grade tell us whether we will be spending time waiting for latencies (or dealing with re-requests due to timeouts) all of which impact the page load times. When the RTT is lower and lag diminished, then actual Internet usage works 'faster' and ‘quicker’.
So looking only at the speed (capacity) measure alone, does not tell you how usable your line is.

In terms of lag, the Uverse line has more lag than ‘slower’ DSL line. So that DSL user has a more usable and steady line, allowing their web pages to load more consistently and quicker. VoIP will be smooth and steady.
So, in summary, the speed of your line breaks down as follows:

What Affects DSL Line Speeds
Top of bar – the Speed your ISP claims, typically the actual DSL line or cable modem sync
You loose around 9% for DSL overhead, more if using a protocol like PPPoE
This leaves an actual maximum usable Internet traffic capacity of around 11Mbps
The typical uncontrolled speed test result will fluctuate within the next 5%
A Typical managed speed test result will be within another 10 to 15%
If your line suffers from backhaul sag due to limited connectivity between the line concentrator and the ISP, any measurement can be well below the levels above at various points in the day.
Again, this is a capacity measure, not an indicator of ‘how fast will my page load’
On a cable line, there is less overhead, so the typical variance will be in the 5 to 10% lower for a full managed test. For example, a 100Mbps cable line will measure as 90Mbps from a laptop running through the IQrouter, but the latencies can be up to 100 times lower!
And just to illustrate that speed is not everything, a big complex web page (news site with 300 or so URL requests) only loads 2.5 times faster on a 100Mbps cable line than a 10Mbps DSL line (both with IQrouters), so even though there is a 10x ‘speed’ difference, the page load improvement is much less.
And when the cable line was compared without an IQrouter, the page load was a bit slower than the DSL line with the IQrouter. That’s how much latencies can affect real world activities.

Router Latency in Milliseconds
The average latency under load measure shows that a managed line has huge benefits for things that are sensitive to lag, which is pretty much everything, but especially noticeable in real-time applications like Google docs, VoIP, streaming, etc.
This Bufferbloat is what kills the quality of your line. Keeping this to a minimum is what the IQrouter works very hard at, resulting in huge improvements.

Managed vs unmanaged round trip times
The managed line will load pages 1.6 to 3.9 times quicker, delivering to the user real ‘speed’ in what matters, like getting a page loaded.
So learning how to interpret the speed test results, and looking for the items that matter is important. Our page on Internet Quality tests discusses the various test tools and sites you can use to get relevant metrics.
Bottom line, an IQrouter provides the responsive performance, consistency and usability we all want for our daily Internet usage. Just don’t expect it to show the lines top speed (capacity) in the typical tests, as it’s doing its job managing traffic.